Here is an example Python program for graphing numeric data from the Double Pendulum simulation. See Getting Numbers with VarsHistory for how to obtain the numeric data.
# graph data in the file dbl-pendulum-data.txt
# that file was created in the DoublePendulum simulation on myphysicslab
# using the following script:
#    var hist = new VarsHistory(sim.getVarsList());
#    simRun.addMemo(hist);
#    hist.setNumberFormat((n) => n.toFixed(2));
#    hist.setVariables([9,0,1,2,3]);
#    hist.memorize()
# the variables in the file are:
# time	angle-1	angle-1 velocity	angle-2	angle-2 velocity
import matplotlib.pyplot as plt
hnd = open("dbl-pendulum-data.txt", "r")
# arrays to collect (x,y) points for later plotting
ta = [] # time array
ya1 = []
ya2 = []
ya3 = []
ya4 = []
line = 0
while True:
	buff = hnd.readline()
	if not buff:
		break
	line += 1
	buff=buff.strip()
	if line==1:
		names = buff.split('\t')
	if line>1:
		b = [float(x) for x in buff.split()]
		if (len(b)<5):
			continue
		ta.append(b[0])
		ya1.append(b[1])
		ya2.append(b[2])
		ya3.append(b[3])
		ya4.append(b[4])
hnd.close()
plt.plot(ta, ya1, 'k', label=names[1])
plt.plot(ta, ya2, 'r', label=names[2])
plt.plot(ta, ya3, 'g', label=names[3])
plt.plot(ta, ya4, 'b', label=names[4])
plt.xlabel('time', fontsize=12)
plt.legend()
plt.show()
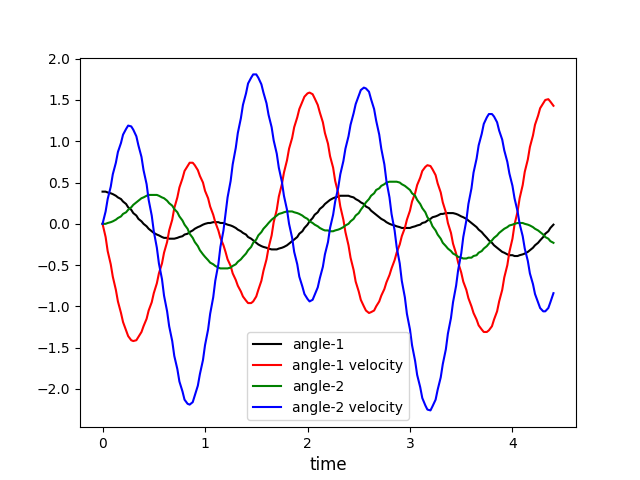
It produces this graph
The data file begins with the following lines
time	angle-1	angle-1 velocity	angle-2	angle-2 velocity
0.00	0.39	0.00	0.00	0.00
0.03	0.39	-0.16	0.00	0.15
0.05	0.38	-0.33	0.01	0.30
0.08	0.37	-0.49	0.02	0.45
0.10	0.36	-0.64	0.03	0.60
0.13	0.34	-0.80	0.05	0.74
0.15	0.32	-0.94	0.07	0.87
0.18	0.30	-1.08	0.09	0.98
0.20	0.27	-1.19	0.12	1.08
0.23	0.24	-1.29	0.14	1.15
0.25	0.20	-1.36	0.17	1.19
0.28	0.17	-1.41	0.20	1.18
0.30	0.13	-1.42	0.23	1.14
0.33	0.10	-1.41	0.26	1.06
0.35	0.06	-1.37	0.28	0.95
0.38	0.03	-1.31	0.31	0.81