To get numeric data from a myPhysicsLab simulation using the VarsHistory class, follow the steps below.
Open the terminal window by clicking the “terminal” checkbox.
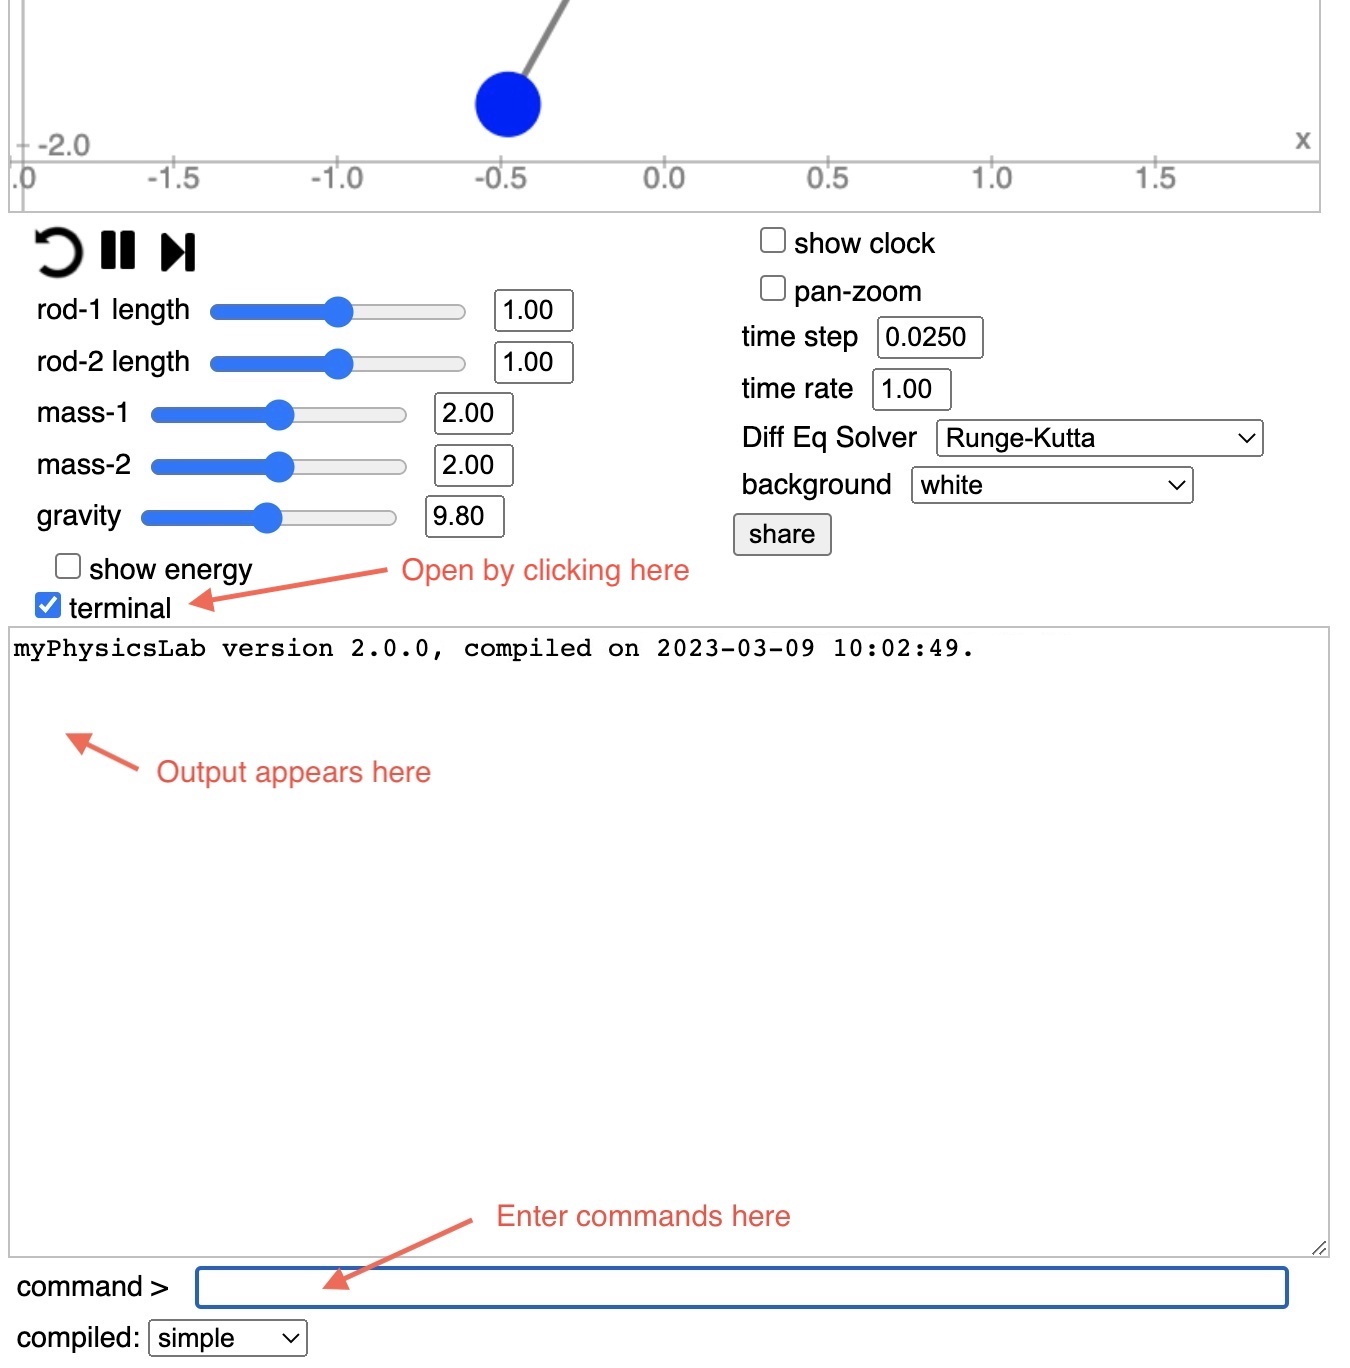
Type help in the command box (and hit return of course) to see available Terminal
commands.
Set your desired initial conditions on the simulation. Type or paste into the Terminal command box:
var hist = new VarsHistory(sim.getVarsList());
simRun.addMemo(hist);
hist.memorize();
To memorize the starting initial conditions, we call the memorize() function once
before starting the simulation.
Run the simulation as long as you want. Click the “stop” button (or use a script to automatically stop at a certain time). In the Terminal command box type:
hist.output()
This will print the data in Terminal output box. (Note: Don’t type a semi-colon “;” at the end of that line, the semi-colon suppresses the output in Terminal).
Here is how this would look in the Double Pendulum simulation.
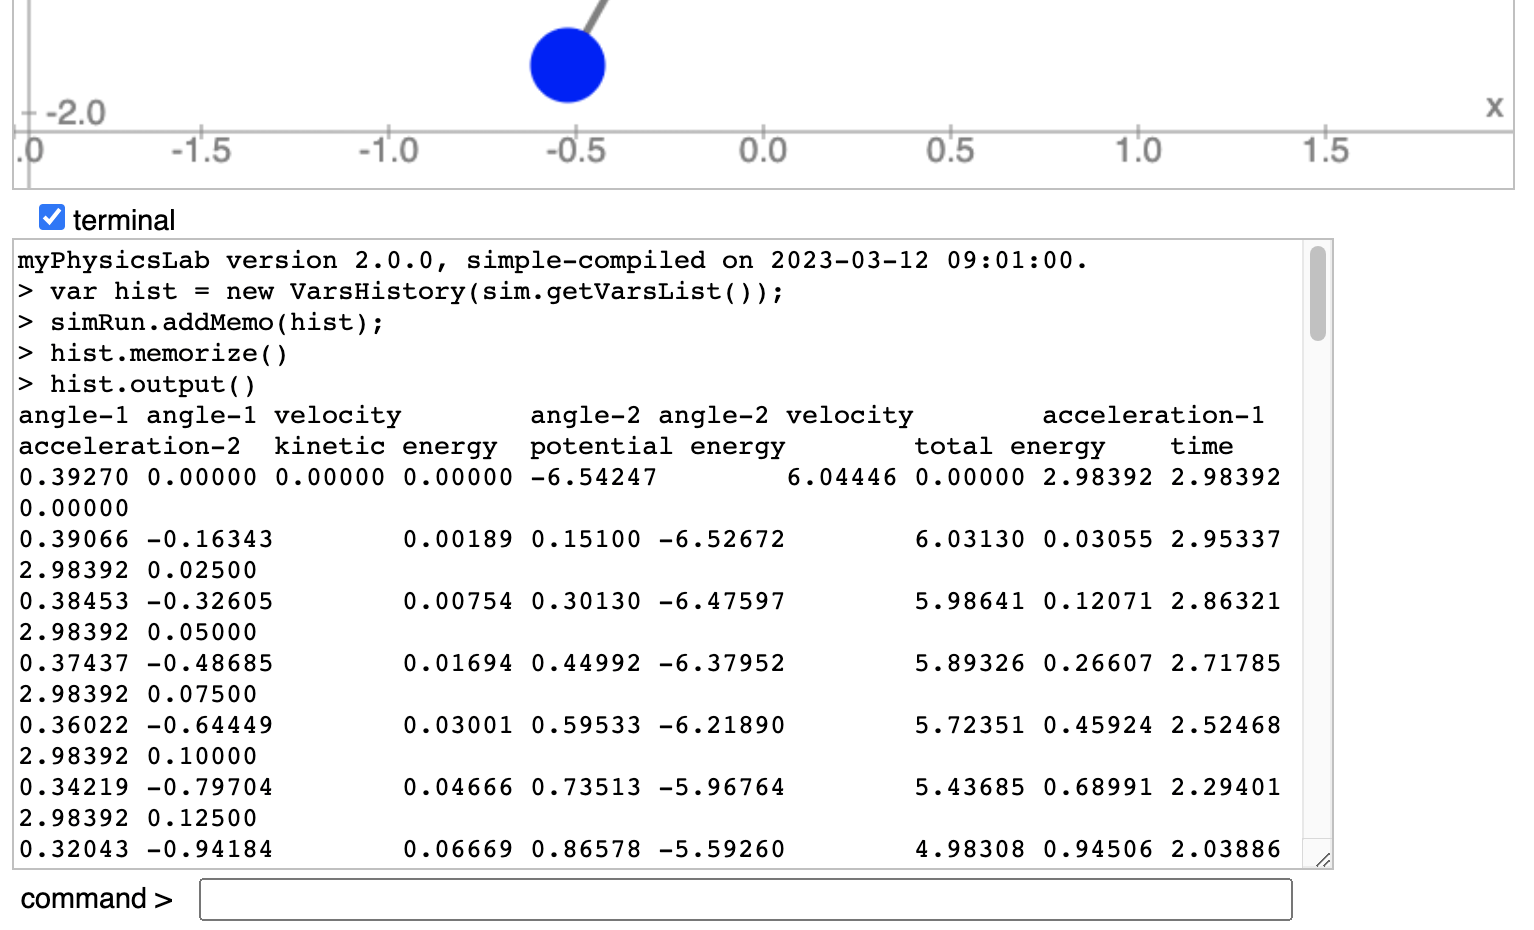
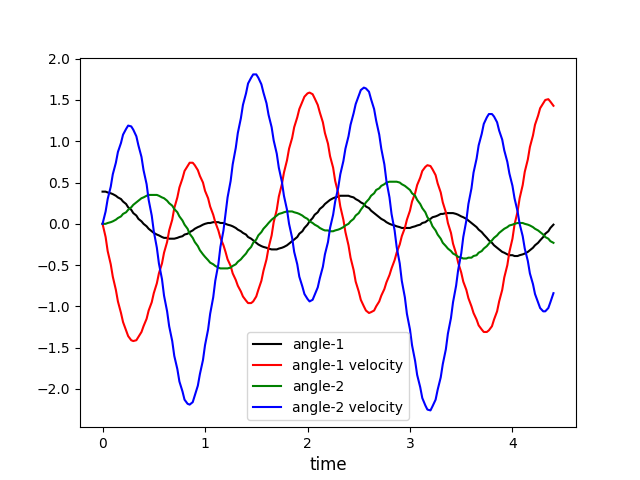
The first line contains the names of the variables. You can then select the text, copy and paste to a spreadsheet or text file. For example I was able to generate this graph from the Double Pendulum with a simple Python program.
The default separator between numbers is the tab character. To instead use comma separated values:
hist.setSeparator(', ');
Use setNumberFormat to change the number formatting function. For example to show only two decimal places
hist.setNumberFormat((n) => n.toFixed(2));
You can use
Javascript’s Number.toExponential
or one of the myphysicslab.lab.Util number format functions like
Util.NF5E.
The above example uses an arrow function
but you can provide any function that takes one numeric argument and returns a string. Here is an equivalent non-arrow function:
hist.setNumberFormat(function(n) { return n.toFixed(2)});
To change which variables are sampled or their order use setVariables. For example:
hist.setVariables([9,0,1,2,3])
Find the index numbers of the variables by typing the command names into the Terminal
command box. In the
Double Pendulum
simulation you would see this
SIM_VARS.ANGLE_1;
SIM_VARS.ANGLE_1_VELOCITY;
SIM_VARS.ANGLE_2;
SIM_VARS.ANGLE_2_VELOCITY;
SIM_VARS.ACCELERATION_1;
SIM_VARS.ACCELERATION_2;
SIM_VARS.KINETIC_ENERGY;
SIM_VARS.POTENTIAL_ENERGY;
SIM_VARS.TOTAL_ENERGY;
SIM_VARS.TIME
So variable 0 is ANGLE_1, variable 1 is ANGLE_1_VELOCITY, etc. Another way to find
index numbers of variables is with the command prettyPrint(varsList) which in the
Double Pendulum produces
> prettyPrint(varsList)
VarsList{
  name_: "SIM_VARS",
  numVars: 10,
  timeIdx_: 9,
  history_: false,
  (0) ANGLE_1: 0.39270,
  (1) ANGLE_1_VELOCITY: 0.00000,
  (2) ANGLE_2: 0.00000,
  (3) ANGLE_2_VELOCITY: 0.00000,
  (4) ACCELERATION_1: -6.54247,
  (5) ACCELERATION_2: 6.04446,
  (6) KINETIC_ENERGY: 0.00000,
  (7) POTENTIAL_ENERGY: 2.98392,
  (8) TOTAL_ENERGY: 2.98392,
  (9) TIME: 0.00000,
Note that calling setVariables erases all stored data from the VarsHistory. Therefore
you should call memorize afterwards to store the initial conditions.
Here is a Terminal session that shows using several of these commands together in the Double Pendulum simulation.
> var hist = new VarsHistory(sim.getVarsList());
> simRun.addMemo(hist);
> hist.setNumberFormat((n) => n.toFixed(2));
> hist.setSeparator(',   ');
> hist.setVariables([9,0,1,2,3]);
> hist.memorize();
> hist.output()
time,   angle-1,   angle-1 velocity,   angle-2,   angle-2 velocity
0.00,   0.39,   0.00,   0.00,   0.00
0.03,   0.39,   -0.16,   0.00,   0.15
0.05,   0.38,   -0.33,   0.01,   0.30
0.08,   0.37,   -0.49,   0.02,   0.45
0.10,   0.36,   -0.64,   0.03,   0.60
0.13,   0.34,   -0.80,   0.05,   0.74
0.15,   0.32,   -0.94,   0.07,   0.87
0.18,   0.30,   -1.08,   0.09,   0.98
0.20,   0.27,   -1.19,   0.12,   1.08
0.23,   0.24,   -1.29,   0.14,   1.15
0.25,   0.20,   -1.36,   0.17,   1.19