To get numeric data from a myPhysicsLab simulation using Javascript, follow the steps below.
Open the terminal window by clicking the “terminal” checkbox.
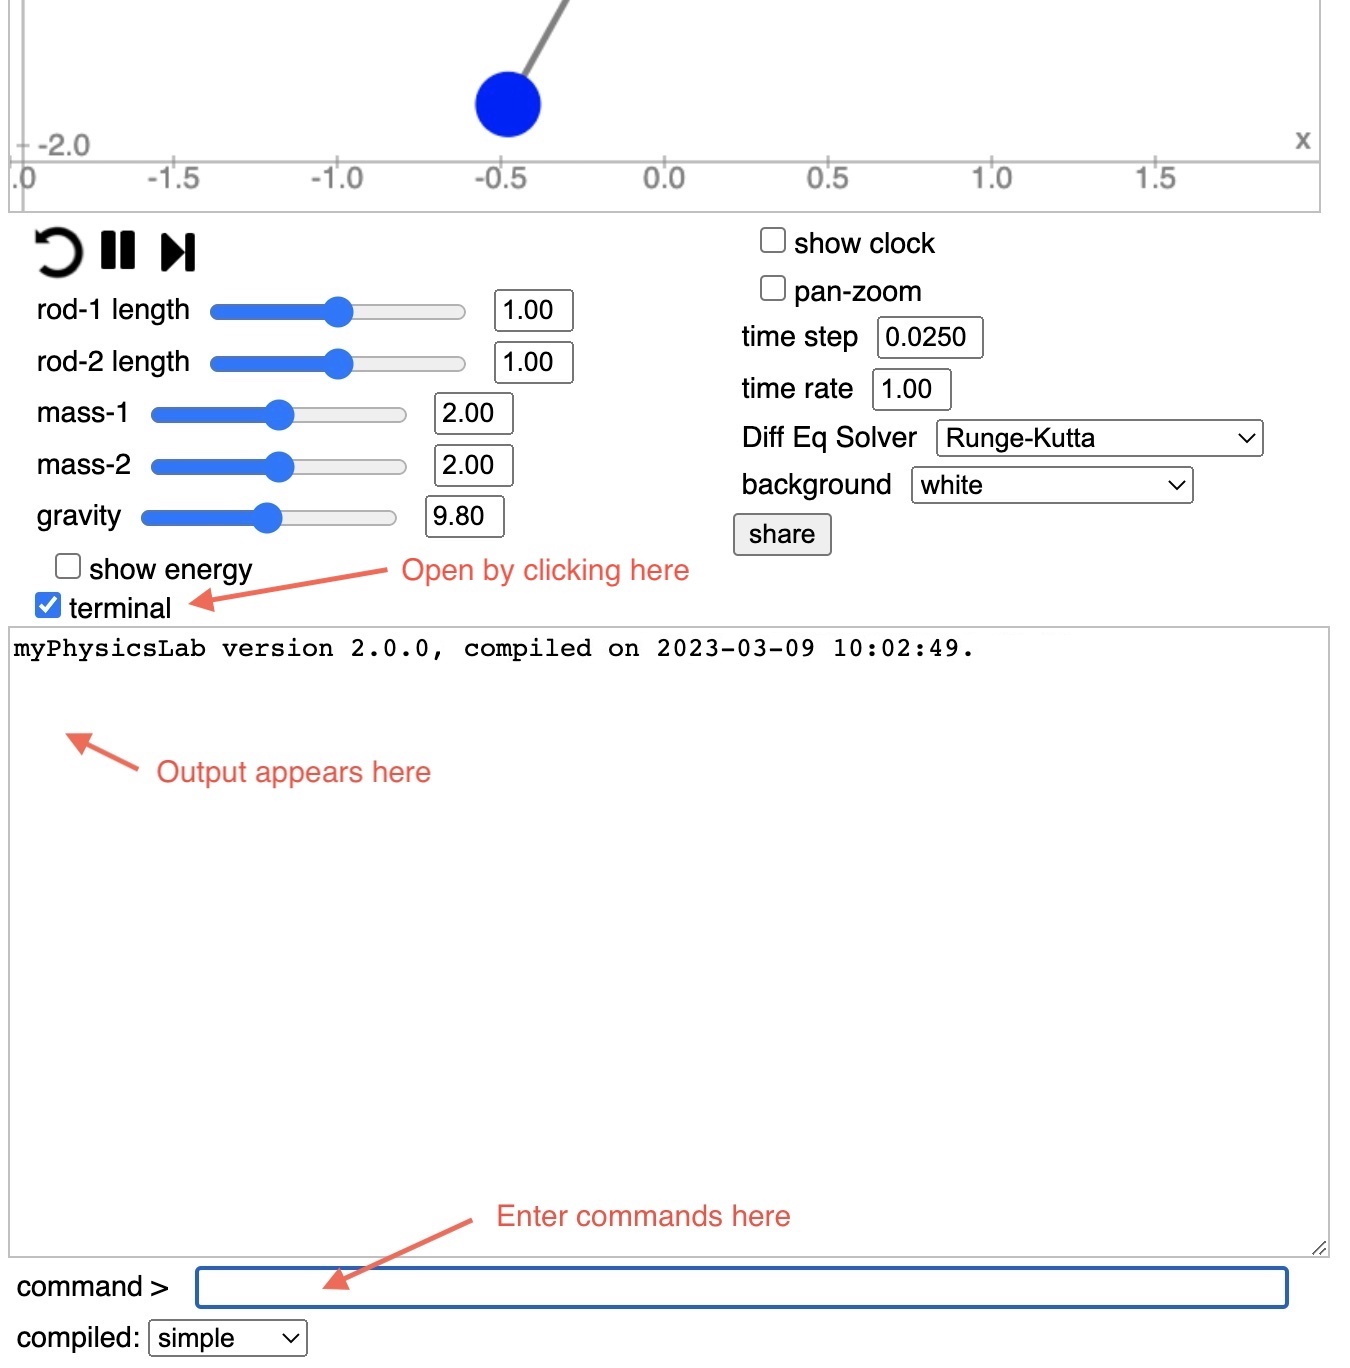
Type help in the command box (and hit return of course) to see available Terminal
commands.
Set your desired initial conditions on the simulation.
Find the names of the variables by typing names into the Terminal command box. For the
Double Pendulum
simulation you would see a list ending with this
SIM_VARS.ANGLE_1;
SIM_VARS.ANGLE_1_VELOCITY;
SIM_VARS.ANGLE_2;
SIM_VARS.ANGLE_2_VELOCITY;
SIM_VARS.ACCELERATION_1;
SIM_VARS.ACCELERATION_2;
SIM_VARS.KINETIC_ENERGY;
SIM_VARS.POTENTIAL_ENERGY;
SIM_VARS.TOTAL_ENERGY;
SIM_VARS.TIME
Enter the following script into the Terminal command box. (You can copy and paste all the lines at once.)
var angle1 = sim.getVarsList().getVariable('ANGLE_1');
var angle1v = sim.getVarsList().getVariable('ANGLE_1_VELOCITY');
var angle2 = sim.getVarsList().getVariable('ANGLE_2');
var angle2v = sim.getVarsList().getVariable('ANGLE_2_VELOCITY');
var timeVar = sim.getVarsList().getVariable('TIME');
var printVar = (v) => v.getValue().toFixed(3);
var memo = new GenericMemo(function(){
  println(printVar(timeVar)+'\t'
  +printVar(angle1)+'\t'
  +printVar(angle1v)+'\t'
  +printVar(angle2)+'\t'
  +printVar(angle2v)
)});
simRun.addMemo(memo);
memo.memorize();
To memorize the starting initial conditions, call the memorize() function once before
starting the simulation.
Modify the printVar function to format the numbers however you want.
For example you can use
Javascript’s Number.toExponential
or one of the myphysicslab.lab.Util number format functions like
Util.NF5E.
To see it working try this link (and click the “play” button).
Run the simulation as long as you want. Click the “stop” button (or use a script to automatically stop at a certain time). You will see output like this:
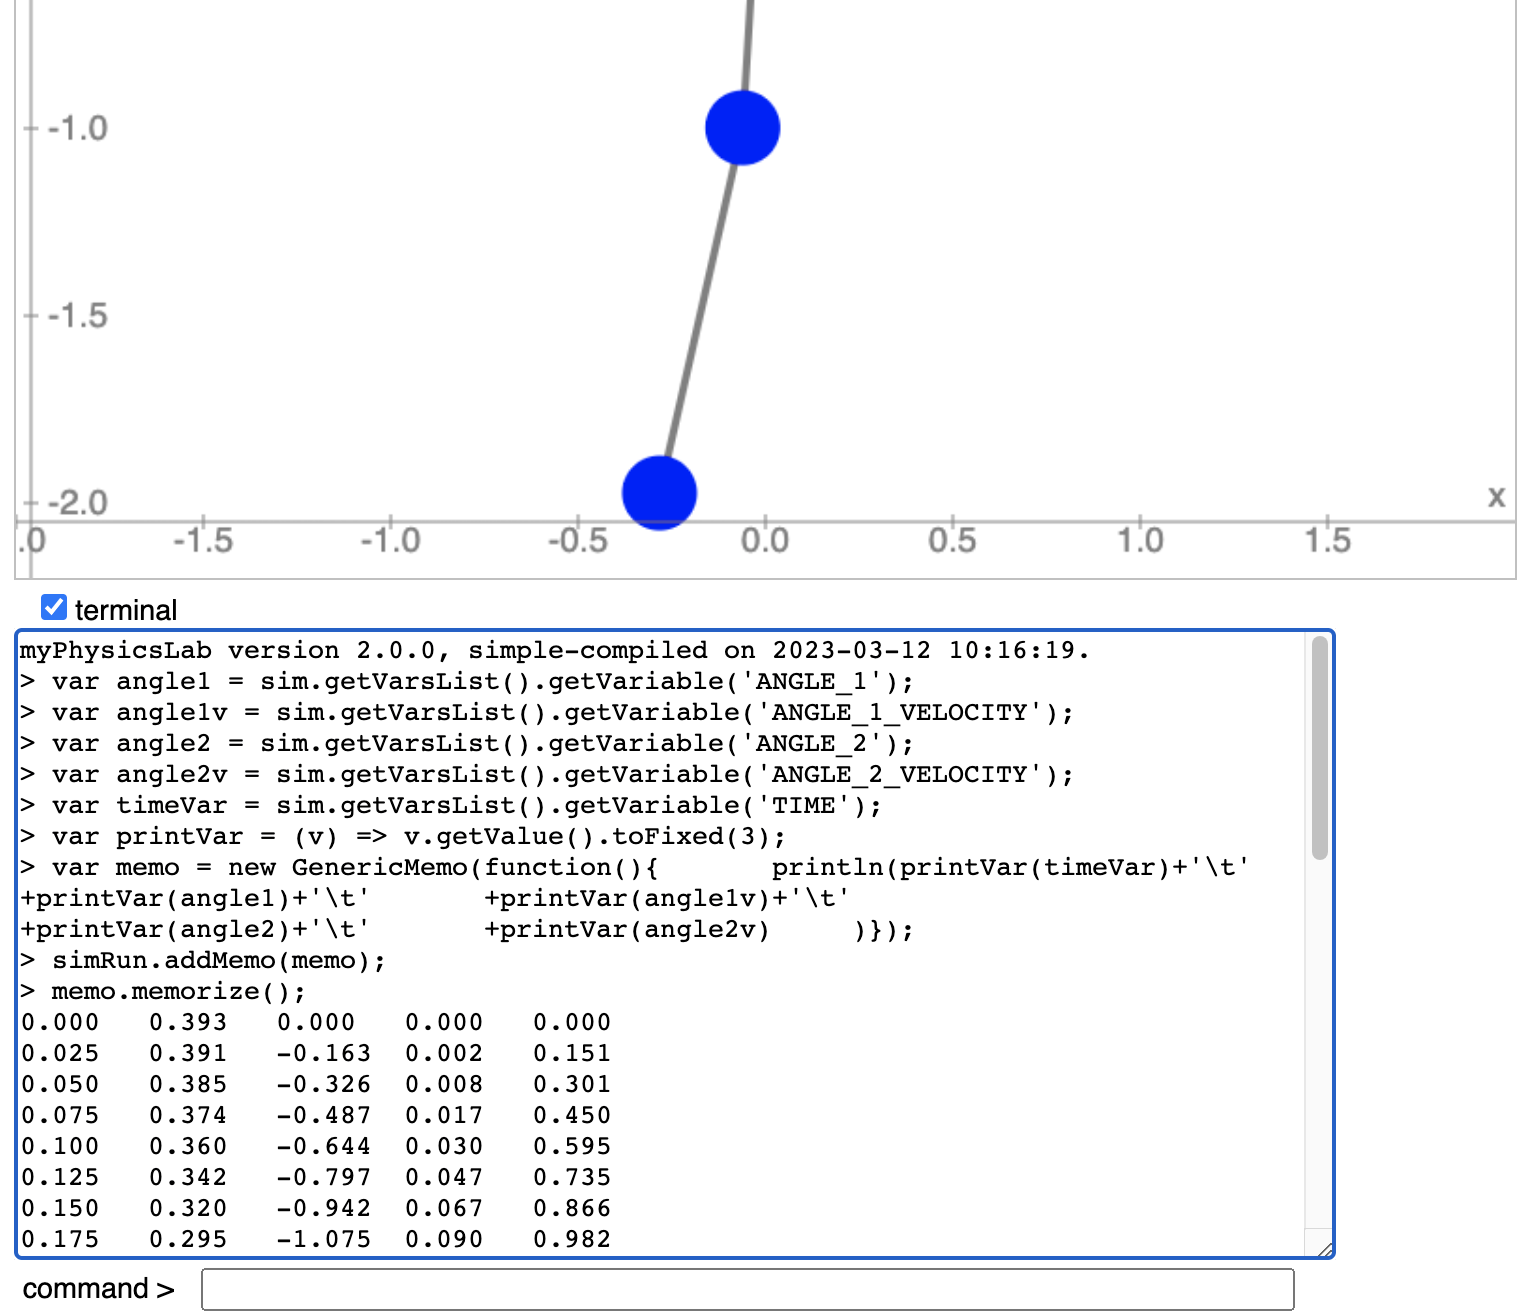
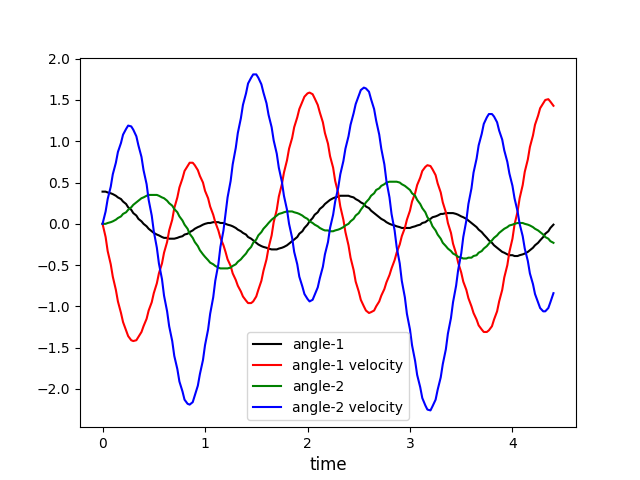
Select the numeric text, copy and paste to a spreadsheet or text file. For example, here is a graph generated from the Double Pendulum with a simple Python program.
To print less data, modify the script to use a time interval. The lastPrint variable
remembers when we last printed data.
var angle1 = sim.getVarsList().getVariable('ANGLE_1');
var angle1v = sim.getVarsList().getVariable('ANGLE_1_VELOCITY');
var angle2 = sim.getVarsList().getVariable('ANGLE_2');
var angle2v = sim.getVarsList().getVariable('ANGLE_2_VELOCITY');
var timeVar = sim.getVarsList().getVariable('TIME');
var printVar = (v) => v.getValue().toFixed(3);
var lastPrint = -1;
var memo = new GenericMemo(function(){
  var t=timeVar.getValue();
  if (t-lastPrint>=0.24) {
    lastPrint=t;
    println(printVar(timeVar)+'\t'
        +printVar(angle1)+'\t'
        +printVar(angle1v)+'\t'
        +printVar(angle2)+'\t'
        +printVar(angle2v))
  }
});
simRun.addMemo(memo);
memo.memorize();
(Note we use 0.24 instead of 0.25 to get output every 0.25 seconds, because the underlying time step is 0.025 and numerical errors mean time is not always an exact multiple of 0.025.)
Here is output from running the above script in the Double Pendulum simulation. Time is in the first column.
0.000	0.393	0.000	0.000	0.000
0.250	0.202	-1.363	0.173	1.185
0.500	-0.108	-0.836	0.354	-0.092
0.750	-0.160	0.443	0.094	-1.909
1.000	-0.003	0.404	-0.404	-1.474
1.250	-0.020	-0.515	-0.525	0.523
1.500	-0.226	-0.881	-0.188	1.810
1.750	-0.292	0.476	0.130	0.513
2.000	-0.010	1.581	0.056	-0.914
2.250	0.308	0.676	-0.087	0.109
2.500	0.284	-0.821	0.135	1.549
2.750	0.039	-0.792	0.480	0.717